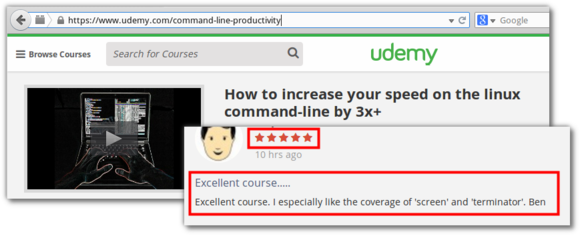
I created a Udemy course on my favourite linux commandline productivity techniques
Fri, 2014-12-26 18:31 | by Samuel LampaThis is something I've been thinking of for a looong long time: Creating a course covering my favourite linux commandline productivity techniques!
The background is that during my year at UPPMAX super computing center, where we were workikng all days in the terminal, I started looking for the perfect set of easy to implement techniques, that could save me the most time and unneccessary strains in the wrists etc, without getting me drowned in complicated setups that would not work on all computers etc. So, I started thinking about gathering all these lessons in a course.
Not until this summer, when I discovered the awesome udemy platform, did I get it done though (and many months later, after I got the last bits finished, it got published)!
Guess if I was happy about the very first review I got, was a full five star! :), reading "Excellent course. I especially like the coverage of 'screen' and 'terminator'. Ben"):
Anyways, find below a special 50% off coupon just for you my blog readers (with life-time access to the course). Hope you will enjoy the course as well:
(Note: Erroneous link fixed on Feb 14, 2015. Contact me if you used the wrong link by mistake!)
Hope you will enjoy the course as much as I enjoyed creating it! :)
My top-languages-per-use-case list
Wed, 2014-04-30 14:35 | by Samuel LampaI have spent considerable time trying to keep up with what happens in the programming language world, perhaps with a little hope of finding the "ultimate programming language" ... that I can use for all my projects :)
Of course, what I have found instead, is that really, the most languages have quite sharp niches, and that it turns out to be hard to find a silver bullet that is good for a lot of stuff. A bit disappointing, since I don't think that is out of ultimate necessity. As the wisdom goes, one should "use the right tool for the job".
Anyway, then there still remains to find out which is the right tool for the job, within a lot of different areas (I'm aspiring to do stuff in a lot of these areas), and so I have tried to sum up my impressions and patchy knowledge about the different current languages, and have concluded the following top list, for different categories:
- Simple system scripting: Bash
- Python is often overkill, and is not as readily interoperable as bash scripts.
- IPython scripts might come close though.
- Various automation scripts and commandline tools that need to integrate with a lot of tools and languages: Python
- Go has too bad support for things like bindings to R
- High performance command-line tools or web services: Go
- D has too cumbersome multi-threading support
- Python is not high performance enough
- C is awful for working with strings
- High performance tools doing some more advanced high level stuff, or native linux user interfaces: D
- Go lacks generics and a good user interface library for linux
- Cross-platform native user interfaces: Free Pascal and Lazarus
- Things that has to run on the JVM: Java / Scala
- Web sites: PHP (With ProcessWire or Laravel)
- Distributed Systems: Elixir
- Erlang itself seems a bit too clunky
- Expert systems and rule based reasoning: Prolog
The smallest pipeable python script
Wed, 2014-03-05 20:59 | by Samuel LampaPython is a very capable scripting language, but when I was new to it, I felt that it was rather verbose, and hard to express things in a short way. I have subsequently learned that this is all about finding the name of the appropriate library, and a little bit about how to optimally use the syntactic sugars in python.
Therefore, it turns out useful to gather a bunch of snippets, for reminding about how to go about certain typical task.
One such task, when working in a unix environment, is how to write text processing scripts that accept input on standard input, and writes the output on standard out, so that the script can easily be chained together with other tools by the use of unix pipes.
The above is easily done in the following way, demonstrated below in its (almost) shortest possible syntax:
from sys import stdin, stdout

for line in stdin:
    stdout.write(line)
Vote for ProcessWire to be packaged as a BitNami image
Thu, 2014-01-16 07:33 | by Samuel LampaThe ProcessWire open source PHP CMS is definitely worth to be win the BitNami contest to become the next software to be packaged as a BitNami image (to be easily installed on AWS cloud, XAMPP (Multi-platform LAMP stack for devs) etc, so please help it by taking 1 second and voting for it here (no login required, just click, and optionally also tweet about it):
New Google+ communities: Bioclipse, Cheminformatics, Semantic MediaWiki
Wed, 2013-10-16 11:19 | by Samuel LampaAfter spending countless hours on Google+, I have realized how useful their new group feature is, for sharing/finding interesting stuff happening around different technologies. It's nice handling of previews of movies, images, webpages etc makes it so much easier to spot interesting stuff. IMO it works FAR better than e.g. twitter, for this.
E.g. by subscribing to groups for the topics you are interested in (I have over 50...), I get tons of interesting stuff on your Google+ home page all the time.
While Google+ groups definitely don't replace mailing lists and IRC, which are superior for discussions, it is a great complement for sharing interesting stuff happening around a technology.
With this in mind, during the last week or so, I've tried to make sure that a few of my favourite softwares and topics have groups, which resulted in a few new ones:
... so make sure to join those of these that you like, and post some interesting stuff there! :)
Don't use Swedish keyboard with vim/screen/bash
Fri, 2013-08-30 12:28 | by Samuel LampaSomebody told me they always use US keyboard for coding, and that it really makes a difference. I typically don't care too much about such, but when I started getting a slight pain in my wrists the other day, after many days of intense bash-/vim-/screening, I decided to make a try ... and my hands and wrists are forever grateful!
Finally it starts to make sense why somebody would choose a weird character such as " for switching between windows in screen! (something you do very repeateadly sometimes), but having it just one step to the right of the natural position of your right pinkie, makes more sense than the awful crippled left-hand grip to get [shift]-[2] on the swedish keyboard.
Coders in general will save some sanity by avoid the crippled right hand-grip with AltGr+[numkey] to get to [] and {}.
The rest is maybe a little more specific to heavy bash/vim/screen usage. I'll outline a few that I noticed below:
-
:, for the ubiquitous:win vim (for saving( is very comfy placed under your right pinkie (with shift). - The
$sign is much comfier (for selecting to end of line in vim), avoiding another crippled AltGr-grip. - Same goes for the
|sign (piping) -
/, for searching in vim, is really nicely placed one step down and right from the right pinkie. -
"is nicely placed just one step to the right of the pinkie-placement. - Even
~, even though requiring a slightly crippled left-hand grip even in US, at least prints out directly, as opposed to the required space to force it to print, in SE.
I'm sure there are many more, but these should be enough to make it worth to try it out a little if you're spending a lot of time in bash/vim/screen. In short: Only now I can see how anyone can really love working with these vim commands!
Only thing remaining is to find a nice place to map the åäö:s.
So far, I have added these two aliases to my ~/.bash_aliases, though, for quick switching between Swedish and US:
alias kbse='setxkbmap se'
alias kbus='setxkbmap us'
Easier debugging of Go programs on the command line with CGDB
Fri, 2013-08-09 18:56 | by Samuel LampaIn this 4 minute tutorial I quickly go through how to use CGDB to debug a Go program in an easier way than with the GDB debugger directly, since it continuously shows the code context. I cover the basic GDB commands on how to navigate the code, set breakpoints, step line-by-line and into functions and goroutines.
CGDB (http://cgdb.github.io) is a light-weight wrapper around GDB that adds a split window, with the code context above, and the normal GDB console in the bottom. In being totally command line based, it is quite a neat tool, that you can use ever remotely over SSH connections.
Profiling and creating call graphs for Go programs with "go tool pprof"
Thu, 2013-08-08 13:27 | by Samuel LampaUpdate: Now covers - as an alternative - to do this in an even easier way, using Dave Cheney's excellent profile library.
In trying to get my head around the code of the very interesting GoFLow library, (for flow-based programming in Go), and the accompanying flow-based bioinformatics library I started hacking on, I needed to get some kind of visualization (like a call graph) ... something like this:

(And in the end, that is what I got ... read on ... ) :)
I then found out about the go tool pprof command, for which the Go team published a blog post on here.
Being a Go newbie, I must admit I had quite a hard time deciphering the blog post though. Maybe it was just a psychological barrier because of all the technological anechdotes, that made it look harder than it actually was. Anyhow, it didn't help that "go run pprof" didn't produce any output if I didn't run processing on a large enough file that it would have time to collect data.
Anyways, with this in mind I wanted to make a slightly easier-to-follow instruction for newbies like me, on how to use "go tool pprof" for profiling and producing call graphs ... but then after I published this post, Dave Cheney pinged me about his excellent profile package, which makes the process even easier, so I went away and updated the blog post to include how to do it both with the profile package, AND with the pprof library itself! :)
Ok, so enough blather, let's get started:
Easy option: Profiling Go programs with the profile package
Easy option Overview: What you will do
- First you will need to put a very small code snippet in your code, that will output a profile-file (named [something].pprof in your /tmp/ folder) when you run your program.
- This profile file can then be used with the "go run pprof" command to do various things like output reports of top functions taking time, and not the least, producing a graphical call graph, which is what I was most interested in here.
Easy option Step 0: Install profile
If you have your GOROOT and GOPATH environment variables correctly setup, you should be able to install it with this simple command:
go get github.com/davecheney/profile
... otherwise you'll have to install it manually from http://github.com/davecheney/profile
Easy option Step 1: Add a line of code, to produce a profile file
- Add "github.com/davecheney/profile" to your import statement. Something like:
import (
        ... your other imports ...
        "github.com/davecheney/profile"
)
- Add the following line at the beginning of your main() function:
defer profile.Start(profile.CPUProfile).Stop()
... the result should be something like:
func main() {
    defer profile.Start(profile.CPUProfile).Stop()

    // ... your main code here ...
}
Easy option Step 2: Build your program as usual
Something like:
go build [your program].go
Easy option, Step 3: Run your program long enough to get some profiling data
- Now run your program as usual
- Note: Make sure it rung long enough to gather data! I had to run my DNA-processing code on a 58MB file rather than my 7.8KB test file I was using first, to get predictable results.
./[your program]
Easy option, Step 4: Copy the cpu.pprof file from /tmp/...
When running the program in the previous step, you will have seen some output like this:
2013/08/08 16:45:58 profile: cpu profiling enabled, /tmp/profile882806532/cpu.pprof
Copy this file to where you are standing right now, with:
cp /tmp/profile[some number]/cpu.pprof .
Read on from step 4, for the rest of the steps ...
Hard option: Using the pprof library directly
Hard option Overview: What you will do
- First you will need to put in some code snippets (more than in the easy option) in your code, that will output a profile-file (named [something].pprof) when you run your program.
- This profile file can then be used with the "go run pprof" command to do various things like output reports of top functions taking time, and not the least, producing a graphical call graph, which is what I was most interested in here.
Hard option Step 1: Add some code snippets to your code, to produce a profile file
- Add "runtime/pprof" to your import statement. Something like:
import (
        ... your other imports ...
        "flag"
        "fmt"
        "runtime/pprof"
)
- Add this just before your main() function:
// Profiling stuff ... from http://blog.golang.org/profiling-go-programs
var cpuprofile = flag.String("cpuprofile", "", "write cpu profile to file")
- Add the following code at the beginning of your main() function:
    flag.Parse()
    if *cpuprofile != "" {
        f, err := os.Create(*cpuprofile)
        if err != nil {
            fmt.Println("Error: ", err)
        }
        pprof.StartCPUProfile(f)
        defer pprof.StopCPUProfile()
    }
... the result should be something like:
// Profiling stuff ... from http://blog.golang.org/profiling-go-programs
var cpuprofile = flag.String("cpuprofile", "", "write cpu profile to file")

func main() {
    flag.Parse()
    if *cpuprofile != "" {
        f, err := os.Create(*cpuprofile)
        if err != nil {
            fmt.Println("Error: ", err)
        }
        pprof.StartCPUProfile(f)
        defer pprof.StopCPUProfile()
    }

       // ... your main code here ...

}
This will add a command line flag "-cpuprofile", which you can later use to specify a filename where to write the profiling data.
Hard option Step 2: Build your program as usual
Something like:
go build [your program].go
Hard option Step 3: Run your program long enough to get some profiling data
- Now run your program, specifying a filename to the -cpuprofile flag, where to store the profiling data
- Note: Make sure it rung long enough to gather data! I had to run my DNA-processing code on a 58MB file rather than my 7.8KB test file I was using first, to get predictable results.
./[your program] -cpuprofile=cpu.pprof
The rest (Same for easy and hard option!)
Step 4: Get some nice output from your profile data
- Now comes the fun part, where you can do nice stuff with your profile data.
- My favourite here was to output the callgraph as a PDF file:
go tool pprof --pdf [my program] cpu.pprof > callgraph.pdf
Step 5: Enjoy your callgraph
Let's see what that looks like:
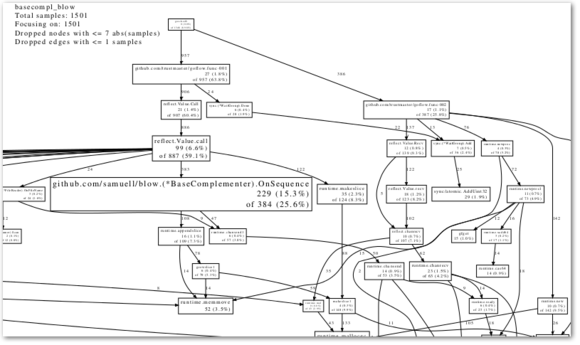
Not too bad, no? (Find the PDF version below as well)
Step 6: Try some other commands
Some other output you might want to do:
- A textual report:
go tool pprof --text [my program] cpu.pprof > report.txt
- Check the outher options:
go tool pprof 2>&1|less
(Isn't there a nicer way to get a paginated help screen?)
Step 7: Go back to the Go team blog post and learn the advanced options
Now, this might have been an easier start if you are a newbie, but then Dave Cheney's post on profile, and the Go team blog post on runtime/pprof contains info on more advanced use of the pprof tool, so be sure to go back and study it:
Python-like generator functions in Go
Tue, 2013-07-30 09:23 | by Samuel LampaEver since I stumbled upon David Beazleys excellent tutorial on python generator functions, I have been very fond of them.
A generator function is basically a function that - rather than return a list of stuff - it returns a sequence of stuff, one for every time the function is executed.
This allows them to be chained together in long pipelines that don't create any temporary data in memory between the different functions, but instead only one item at a time is "drawn" through the chain of (generator) functions (typically by a loop over the last function in the chain). This all means you can process arbitrary amounts of data with constant RAM usage, and which will typically mean a slight speedup too.
After learning to know the Go programming language, I was happy to see that implementing gererator-like functions in Go is quite easy too - and if implemented as goroutines - they will even be multi-threaded by default! I wanted to show how to implement them below.
Generators in Python
First a short look at python generator functions. They can be implemented in two ways (at least). For simplicity, say I want a generator function that takes a string and returns the letters uppercased, one at a time. The classical way to implement this in python is to create a normal function, but just swap the return statement to a yield statement instead, like so:
def generate_uppercase_letters(input_string):
    for letter in input_string:
        yield letter.upper()
The, to use this function, you can simply loop over it:
for letter_upper in generate_uppercase_letters("hej"):
    print letter_upper
Which would produce:
H
E
J
Python also has a much shorter syntax for creating a generator function though (that has no Go-counterpart), which should be worth mentioning (basically it is python's list comprehension, with the square brackets switched to normal parentheses):
(letter.upper() for letter in input_string)
... which makes chaining together even easier:
for letter_upper in (letter.upper() for letter in "hej"):
    print letter_upper
Mimicking generators in Go
Now let's implement the same thing in Go.
package main

import (
    "fmt"
    "strings"
)

func generateUpperCaseLetters(inputString string) chan string {
    // Create a channel where to send output
    outputChannel := make(chan string)
    // Launch an (anonymous) function in another thread, that does
    // the actual processing.
    go func() {
        // Loop over the letters in inputString
        for _, letter := range inputString {
            // Send an uppercased letter to the output channel
            outputChannel <- strings.ToUpper(string(letter))
        }
        // Close the output channel, so anything that loops over it
        // will know that it is finished.
        close(outputChannel)
    }()
    return outputChannel
}

func main() {
    // Loop over the letters communicated over the channel returned
    // from generateUpperCaseLetters() and print them
    for letter := range generateUpperCaseLetters("hej") {
        fmt.Println(letter)
    }
}
So what does this program do? Basically, in the getUppercaseLetters() function, it:
- Creates a channel that it can send output to
- It fires away an (anonymous) function in a separate thread (this is made by the go [function name]() call)
- ... an this function running in a separate thread, loops over the input string and sends the results back, one letter at a time, on the output channel, and when done, closes the channel to notify that it is indeed done.
- Returns the output channel.
Now, when the getUppercaseLetters() function is executed, what you get back is not the result, and the actual content of function is not yet executed - exactly in the same way as with generator functions.
Only when you start looping over it as a range in the main() function, this "generator-like" function will start converting characters to uppercase. This all has to do with how channels work, that they both synchronize and communicate at the same time ... (that is, the channel is not filled with a new value until one is picked away from it first). But you can read much better info about that over at golang.org.
So, in conclusion: You can quite eaily implement python-generator-like functions in Go too ... definitely not as short and succinct as in in python, but for a threaded, compiled program, it's not at all too bad IMO!
Now, to see how this can be used in practice, to speed up a chain of line-by-line processing functions with up to 65%, have a look at this previous blog post!
Comments? Leave them here.
Lessons learned from UPPNEX just published in GigaScience
Wed, 2013-07-03 09:50 | by Samuel LampaI have forgot to blog about it, but let's at least put the link here, to our new GigaScience paper, summarizing our "Lessons learned from implementing a national infrastructure in Sweden for storage and analysis of next-generation sequencing data":
Recent blog posts
- I created a Udemy course on my favourite linux commandline productivity techniques
- My top-languages-per-use-case list
- The smallest pipeable python script
- Vote for ProcessWire to be packaged as a BitNami image
- Calling Java from Python without the JVM startup latency: NailGun and JPype
- New Google+ communities: Bioclipse, Cheminformatics, Semantic MediaWiki
- Don't use Swedish keyboard with vim/screen/bash
- Easier debugging of Go programs on the command line with CGDB
- Profiling and creating call graphs for Go programs with "go tool pprof"
- Python-like generator functions in Go