Go
Easier debugging of Go programs on the command line with CGDB
Fri, 2013-08-09 18:56 | by Samuel LampaIn this 4 minute tutorial I quickly go through how to use CGDB to debug a Go program in an easier way than with the GDB debugger directly, since it continuously shows the code context. I cover the basic GDB commands on how to navigate the code, set breakpoints, step line-by-line and into functions and goroutines.
CGDB (http://cgdb.github.io) is a light-weight wrapper around GDB that adds a split window, with the code context above, and the normal GDB console in the bottom. In being totally command line based, it is quite a neat tool, that you can use ever remotely over SSH connections.
Profiling and creating call graphs for Go programs with "go tool pprof"
Thu, 2013-08-08 13:27 | by Samuel LampaUpdate: Now covers - as an alternative - to do this in an even easier way, using Dave Cheney's excellent profile library.
In trying to get my head around the code of the very interesting GoFLow library, (for flow-based programming in Go), and the accompanying flow-based bioinformatics library I started hacking on, I needed to get some kind of visualization (like a call graph) ... something like this:

(And in the end, that is what I got ... read on ... ) :)
I then found out about the go tool pprof command, for which the Go team published a blog post on here.
Being a Go newbie, I must admit I had quite a hard time deciphering the blog post though. Maybe it was just a psychological barrier because of all the technological anechdotes, that made it look harder than it actually was. Anyhow, it didn't help that "go run pprof" didn't produce any output if I didn't run processing on a large enough file that it would have time to collect data.
Anyways, with this in mind I wanted to make a slightly easier-to-follow instruction for newbies like me, on how to use "go tool pprof" for profiling and producing call graphs ... but then after I published this post, Dave Cheney pinged me about his excellent profile package, which makes the process even easier, so I went away and updated the blog post to include how to do it both with the profile package, AND with the pprof library itself! :)
Ok, so enough blather, let's get started:
Easy option: Profiling Go programs with the profile package
Easy option Overview: What you will do
- First you will need to put a very small code snippet in your code, that will output a profile-file (named [something].pprof in your /tmp/ folder) when you run your program.
- This profile file can then be used with the "go run pprof" command to do various things like output reports of top functions taking time, and not the least, producing a graphical call graph, which is what I was most interested in here.
Easy option Step 0: Install profile
If you have your GOROOT and GOPATH environment variables correctly setup, you should be able to install it with this simple command:
go get github.com/davecheney/profile
... otherwise you'll have to install it manually from http://github.com/davecheney/profile
Easy option Step 1: Add a line of code, to produce a profile file
- Add "github.com/davecheney/profile" to your import statement. Something like:
import (
        ... your other imports ...
        "github.com/davecheney/profile"
)
- Add the following line at the beginning of your main() function:
defer profile.Start(profile.CPUProfile).Stop()
... the result should be something like:
func main() {
    defer profile.Start(profile.CPUProfile).Stop()

    // ... your main code here ...
}
Easy option Step 2: Build your program as usual
Something like:
go build [your program].go
Easy option, Step 3: Run your program long enough to get some profiling data
- Now run your program as usual
- Note: Make sure it rung long enough to gather data! I had to run my DNA-processing code on a 58MB file rather than my 7.8KB test file I was using first, to get predictable results.
./[your program]
Easy option, Step 4: Copy the cpu.pprof file from /tmp/...
When running the program in the previous step, you will have seen some output like this:
2013/08/08 16:45:58 profile: cpu profiling enabled, /tmp/profile882806532/cpu.pprof
Copy this file to where you are standing right now, with:
cp /tmp/profile[some number]/cpu.pprof .
Read on from step 4, for the rest of the steps ...
Hard option: Using the pprof library directly
Hard option Overview: What you will do
- First you will need to put in some code snippets (more than in the easy option) in your code, that will output a profile-file (named [something].pprof) when you run your program.
- This profile file can then be used with the "go run pprof" command to do various things like output reports of top functions taking time, and not the least, producing a graphical call graph, which is what I was most interested in here.
Hard option Step 1: Add some code snippets to your code, to produce a profile file
- Add "runtime/pprof" to your import statement. Something like:
import (
        ... your other imports ...
        "flag"
        "fmt"
        "runtime/pprof"
)
- Add this just before your main() function:
// Profiling stuff ... from http://blog.golang.org/profiling-go-programs
var cpuprofile = flag.String("cpuprofile", "", "write cpu profile to file")
- Add the following code at the beginning of your main() function:
    flag.Parse()
    if *cpuprofile != "" {
        f, err := os.Create(*cpuprofile)
        if err != nil {
            fmt.Println("Error: ", err)
        }
        pprof.StartCPUProfile(f)
        defer pprof.StopCPUProfile()
    }
... the result should be something like:
// Profiling stuff ... from http://blog.golang.org/profiling-go-programs
var cpuprofile = flag.String("cpuprofile", "", "write cpu profile to file")

func main() {
    flag.Parse()
    if *cpuprofile != "" {
        f, err := os.Create(*cpuprofile)
        if err != nil {
            fmt.Println("Error: ", err)
        }
        pprof.StartCPUProfile(f)
        defer pprof.StopCPUProfile()
    }

       // ... your main code here ...

}
This will add a command line flag "-cpuprofile", which you can later use to specify a filename where to write the profiling data.
Hard option Step 2: Build your program as usual
Something like:
go build [your program].go
Hard option Step 3: Run your program long enough to get some profiling data
- Now run your program, specifying a filename to the -cpuprofile flag, where to store the profiling data
- Note: Make sure it rung long enough to gather data! I had to run my DNA-processing code on a 58MB file rather than my 7.8KB test file I was using first, to get predictable results.
./[your program] -cpuprofile=cpu.pprof
The rest (Same for easy and hard option!)
Step 4: Get some nice output from your profile data
- Now comes the fun part, where you can do nice stuff with your profile data.
- My favourite here was to output the callgraph as a PDF file:
go tool pprof --pdf [my program] cpu.pprof > callgraph.pdf
Step 5: Enjoy your callgraph
Let's see what that looks like:
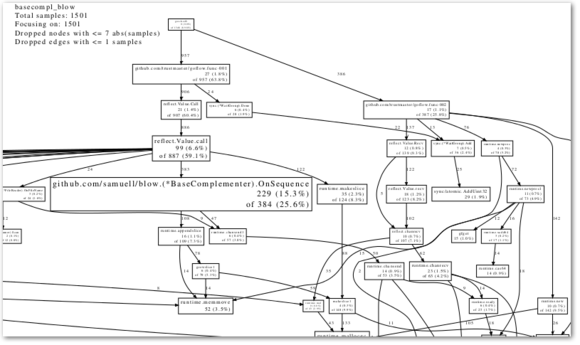
Not too bad, no? (Find the PDF version below as well)
Step 6: Try some other commands
Some other output you might want to do:
- A textual report:
go tool pprof --text [my program] cpu.pprof > report.txt
- Check the outher options:
go tool pprof 2>&1|less
(Isn't there a nicer way to get a paginated help screen?)
Step 7: Go back to the Go team blog post and learn the advanced options
Now, this might have been an easier start if you are a newbie, but then Dave Cheney's post on profile, and the Go team blog post on runtime/pprof contains info on more advanced use of the pprof tool, so be sure to go back and study it:
Python-like generator functions in Go
Tue, 2013-07-30 09:23 | by Samuel LampaEver since I stumbled upon David Beazleys excellent tutorial on python generator functions, I have been very fond of them.
A generator function is basically a function that - rather than return a list of stuff - it returns a sequence of stuff, one for every time the function is executed.
This allows them to be chained together in long pipelines that don't create any temporary data in memory between the different functions, but instead only one item at a time is "drawn" through the chain of (generator) functions (typically by a loop over the last function in the chain). This all means you can process arbitrary amounts of data with constant RAM usage, and which will typically mean a slight speedup too.
After learning to know the Go programming language, I was happy to see that implementing gererator-like functions in Go is quite easy too - and if implemented as goroutines - they will even be multi-threaded by default! I wanted to show how to implement them below.
Generators in Python
First a short look at python generator functions. They can be implemented in two ways (at least). For simplicity, say I want a generator function that takes a string and returns the letters uppercased, one at a time. The classical way to implement this in python is to create a normal function, but just swap the return statement to a yield statement instead, like so:
def generate_uppercase_letters(input_string):
    for letter in input_string:
        yield letter.upper()
The, to use this function, you can simply loop over it:
for letter_upper in generate_uppercase_letters("hej"):
    print letter_upper
Which would produce:
H
E
J
Python also has a much shorter syntax for creating a generator function though (that has no Go-counterpart), which should be worth mentioning (basically it is python's list comprehension, with the square brackets switched to normal parentheses):
(letter.upper() for letter in input_string)
... which makes chaining together even easier:
for letter_upper in (letter.upper() for letter in "hej"):
    print letter_upper
Mimicking generators in Go
Now let's implement the same thing in Go.
package main

import (
    "fmt"
    "strings"
)

func generateUpperCaseLetters(inputString string) chan string {
    // Create a channel where to send output
    outputChannel := make(chan string)
    // Launch an (anonymous) function in another thread, that does
    // the actual processing.
    go func() {
        // Loop over the letters in inputString
        for _, letter := range inputString {
            // Send an uppercased letter to the output channel
            outputChannel <- strings.ToUpper(string(letter))
        }
        // Close the output channel, so anything that loops over it
        // will know that it is finished.
        close(outputChannel)
    }()
    return outputChannel
}

func main() {
    // Loop over the letters communicated over the channel returned
    // from generateUpperCaseLetters() and print them
    for letter := range generateUpperCaseLetters("hej") {
        fmt.Println(letter)
    }
}
So what does this program do? Basically, in the getUppercaseLetters() function, it:
- Creates a channel that it can send output to
- It fires away an (anonymous) function in a separate thread (this is made by the go [function name]() call)
- ... an this function running in a separate thread, loops over the input string and sends the results back, one letter at a time, on the output channel, and when done, closes the channel to notify that it is indeed done.
- Returns the output channel.
Now, when the getUppercaseLetters() function is executed, what you get back is not the result, and the actual content of function is not yet executed - exactly in the same way as with generator functions.
Only when you start looping over it as a range in the main() function, this "generator-like" function will start converting characters to uppercase. This all has to do with how channels work, that they both synchronize and communicate at the same time ... (that is, the channel is not filled with a new value until one is picked away from it first). But you can read much better info about that over at golang.org.
So, in conclusion: You can quite eaily implement python-generator-like functions in Go too ... definitely not as short and succinct as in in python, but for a threaded, compiled program, it's not at all too bad IMO!
Now, to see how this can be used in practice, to speed up a chain of line-by-line processing functions with up to 65%, have a look at this previous blog post!
Comments? Leave them here.
Go speedup with threading, for line by line string processing
Fri, 2013-06-21 10:54 | by Samuel LampaUPDATE, 2013004: With a slightly modified code, and 3 threads (see basecompl_par2.go below), the numbers are now improved: 52%, resp. 80% speedup, depending on how you count, so, almost doubling the speed!
Note: Use this G+ thread if you want to comment/discuss!
Note II: Of course, in reality, for this kind of basic bioinformatics processing, one would use a pre-existing package, like BioGo instead!
Bioinformaticians process a lot of text based files (although the situation is improving and some better formats are emerging, slowly).
The text formats in question typically need to be parsed line-by-line, for practical reasons and for getting clean, modular and understandeable code. I was thus interested to see how much speedup one could gain for such a string processing task, by using the very easy concurrency / parallelization features of the Go programming language.
As test data I used the same 58MB fasta file (uncompressed) as used in my previous explorations.
As a simple test code, I made a very "dumb" code that just computes the DNA base complement back and fourth 4 times (I only do the 4 common letters, no other logic), in order to emulate a 4-step string processing workflow.
- Find the code here.
This code does not do any creation of a new string, or string copying, as part of the processing, so it would not be a good imitaion of such processing (which exists, in the form of for example DNA-to-Protein sequence conversion etc). Thus I also created a version of the code that explicitly does string copy. How dumb it might be, I included it in the test.
- Find this code here.
Finally, I made a parallel version, that spawns go routines for each of the processing steps, which in turn are multiplexed upon 2 threads (set in the program), which turned out to be the optimal for my 1.6GHz Core i5 MacBook air.
- Find this parallel code here.
The results are as follows:
The data in numbers (click for code):
- basecompl_copy.go: 6.98s
- basecompl.go: 5.84s
- basecompl_par.go: 4.23s
- basecompl_par2.go: 3.87s
That is: For the parallel version:
- 51% speedup (cutting 34% exec time) compared to the sequential one without string copy (basecompl.go)
- 80% speedup (cutting 45% time) compared to the one that does string copy anyway (basecompl_copy.go).
Even though one would of course dream about even better speedups, this is not too bad IMO, given that this is the 1st (or second) time in my life that I implement a parallel program (and I picked up Go just 1-2 weeks ago!) and given that this problem mostly consists of disk access and data shuffling, which is hard to parallellize anyway.
Moar Languagez! GC content in Python, D, FPC, C++ and C (and now Go)
Fri, 2013-05-10 17:16 | by Samuel LampaMy two previous blog posts (this one and this one) on comparing the performance of a number of languages for a simple but very typical bioinformatics problem, spurred a whole bunch of people to suggest improvements. Nice! :) Many of the comments can be read in the comments on those posts, as well as in the G+ thread, while I got improvements sent by mail from Thomas Hume (thomas.hume -at- labri.fr) and Daniel Spångberg.
Anyway, here comes an updated post, with a whole array of improvements, and a few added languages.
One suggestion I got (by Thomas Koch, I think), was applicable to all the code examples that I got sent to me, namely to count GC, and AT separately, and add to the total sum only in the end. It basically cut a few percent of all execution times, so I went through all the code variants and added it. It did improve the speed in a simipar way for all the codes.
Many people suggested to read the whole file in once instead of reading line by line though. This can cause problems with the many very large files in bioinformatics, so I have divided the results below in solutions that read line by line, and those that read more than that.
Among the code examples I got, was "our own" Daniel Spångberg of UPPMAX, who wrote a whole bunch of C variants, even including an OpenMP parallelized variant, which takes the absolute lead. Nice! :)
More credits in the explanation of the codes, under each of the results sections.
Ok, so let's go to the results:
Performance results
Reading line by line
Here are first the codes that read only line by line. I wanted to present them first, to give a fair comparison.
| Python | 1.692 |
|---|---|
| Cython | 1.684 |
| Go (8g) | 1.241 |
| Go (gcc) | 0.883 |
| Go Tbl (gcc) | 0.785 |
| Go Tbl (8g) | 0.767 |
| PyPy | 0.612 |
| FPC (MiSchi) | 0.597 |
| D (GDC) | 0.589 |
| FPC | 0.586 |
| FPC (leledumbo) | 0.567 |
| D (DMD) | 0.54 |
| D Tbl (DMD) | 0.492 |
| D (LDC) | 0.479 |
| C++ (HA) | 0.385 |
| D Tbl (GDC) | 0.356 |
| Go Tbl (RP) (8g) | 0.337 |
| Go Tbl (RP) Ptr (8g) | 0.319 |
| D Tbl (LDC) | 0.317 |
| C (DS) | 0.276 |
| C (TH) | 0.252 |
| C (DS Tbl) | 0.183 |
Explanation of code, with links
All of the below codes have have been modified to benefit from the tip from Thomas Koch (thomas -at- koch.ro), to cound AC and GC separately in the inner loop, and sum up only in the end.
Click the language code to see the code!
- Python: My code, with improvents from lelledumbo (here on the blog).
- Cython: Same as "Python", compiled to C with Cython, with statically typed integers.
- Go (8g): Go code compiled with inbuilt Go compiler.
- Go (gcc): Go code compiled with GCC.
- Go Tbl (gcc): Go code, table optimized, and compiled with GCC.
- Go Tbl (8g): Go code, table optimized, and compiled with inbuilt Go compiler.
- PyPy: My python code compiled with PyPy (1.9.0 with GCC 4.7.0)
- FPC (MiSchi): FreePascal version improved by MiSchi (Tonne Schindler)
- D (GDC): My D code, with many improvements suggested from the folks in the G+ thread. Compiled with GDC.
- FPC: My FPC code
- FPC (leledumbo): FreePascal version improved by Leledumbo (leledumbo_cool -at- yahoo.co.id)
- D Tbl (DMD): My table optimized D code, compiled with DMD.
- D (DMD): My D code, compiled with DMD.
- D Tbl (GDC): My table optimized D code, compiled with GDC.
- D (LDC): My D code, compiled with LDC.
- C++ (HA): Harald Aschiz's C++ code.
- Go Tbl (RP) (8g): Roger Peppe's optimized Go code, omitting string conversion and using range.
- Go Tbl (RP) Ptr (8g): Roger Peppe's optimized Go code, additionally using pointers for the table opt.
- D Tbl (LDC): My table optimized D code, compiled with LDC.
- C (DS): Daniel Spångberg's C code (See his even faster ones in the next section!)
- C (TH): Thomas Hume's C code.
- C (DS Tbl): Daniel Spångberg's line-by-line version, with table optimization.
Reading more lines, or whole file
Here are the codes that don't keep themselves to reading line by line, but do more than so. For example Gerdus van Zyl's pypy-optimized code reads a bunch of lines at a time (1k seems optimal), before processing them, while still allowing to process in a line-by-line fashion. Then there is Daniel Spångberg's exercise in C performance, where by reading the file in at once, and applying some smart C tricks, and even doing some OpenMP-parallelization, cuts down the execution time under 100 ms, and that is for a 1million line file, on a rather slow MacBook air. Quite impressive!
| PyPy (GvZ) | PyPy | PyPy (GvZ) + Opt | C (DS Whole) | C (DS Whole Tbl) | C (DS Whole Tbl Par) | C (DS Whole Tbl 16bit) | C (DS Whole Tbl Par 16bit) | C (DS Whole Tbl Par 16bit Unroll) |
|---|---|---|---|---|---|---|---|---|
| 0.862s | 0.626s | 0.551s | 0.178s | 0.114s | 0.095s | 0.084s | 0.070s | 0.066s |
Explanation of code, with links
Note: All of the below codes have been modified to benefit from the tip from Thomas Koch (thomas -at- koch.ro), to cound AC and GC separately in the inner loop, and sum up only in the end.
- PyPy (GvZ): Gerdus van Zyl:s code optimized for PyPy.
- PyPy (GvZ) + Opt: Gerdus van Zyl:s code optimized for PyPy, with even more optimal number of lines per time (1k inst of 10k).
- C (DS Whole): Daniel Spångberg's C code, when reading whole file.
- C (DS Whole Tbl): Like "C (DS Whole), but with Daniel's next improvement: Using a table, to avoid the comparisons in the inner loop.
- C (DS Whole Tbl Par): Like "C (DS Whole Tbl), but with Daniel's final improvement: Parallelizing it with OpenMP.
- C (DS Whole Tbl 16bit): Like DS Whole Tbl, but optimized with reading 16bit at a time, rather than 8.
- C (DS Whole Tbl Par 16bit): Like the above, but OpenMP parallelized.
- C (DS Whole Tbl Par 16bit Unroll): Like the above, but adding -funroll-all-loops to the compiler.
Conclusions
I think there are a number of conclusions one can draw from this:
- C is in it's own class, when it comes to speed, which is seen in both of the categories above.
- C++ is also fast, but D with the right compiler is not far behind.
- Generally D and FPC is very close!
- Pure python is not near the compiled ones, but surprisingly (for me), by using PyPy, it becomes totally comparable with compiled languages!
- If you look both at the speed, and the compactness and readability of code at the same time, I find D to be a very strong competitor in this game, but at the same time, Go is very close, and already has a [code.google.com/p/biogo/ bioinformatics package (biogo)]!
What do you think?
Update May 11: Daniel Spångberg now provided a few even more optimized versions: DS Tbl: a table optimized version of the line-by-line reading, as well as optimized versions of the ones that read the whole file at once. On the fastest one, I also tried with -funroll-all-loops to gcc, to see how far we could get. The result (for a 58MB text file): 66 milliseconds!
Update May 16: Thanks to Franzivan Bezerra's post here, I now got some Go code here as well. I modified Francivan's gode a bit, to comply with our latest optimizations here, as well as created a table optimized version (similar to Daniel Spångberg's Table optimized C code). To give a fair comparison of table optimization, I also added a table optimized D version, compiled with DMD, GDC and LDC. Find the results in the first graph below.
Update II, May 16: The link to the input file, used in the examples, got lost. It can be downloaded here!
Update III, May 16: Thanks to Roger Peppe, suggesting some improved versions in this thread on G+, we now got two more, very fast Go versions, clocking even slightly below the idiomatic C++ code. Have a look in the first graph and table below!
Update IV, May 16: Now applied equivalent optimizations like Roger's ones for Go mentioned above, to the "D Tbl" versions (re-use the "line" var as buffer to readln(), and use foreach instead of for loop). Result: D and Go gets extremely similar numbers: 0.317 and 0.319 was the best I could get for D and Go, respectively. See updated graphs below.
Update May 17: See this post on how Francivan Bezerra acheived same performance as C with D, beating the other two (Go and Java) in the comparison. (Direct link to GDoc)
Recent blog posts
- I created a Udemy course on my favourite linux commandline productivity techniques
- My top-languages-per-use-case list
- The smallest pipeable python script
- Vote for ProcessWire to be packaged as a BitNami image
- Calling Java from Python without the JVM startup latency: NailGun and JPype
- New Google+ communities: Bioclipse, Cheminformatics, Semantic MediaWiki
- Don't use Swedish keyboard with vim/screen/bash
- Easier debugging of Go programs on the command line with CGDB
- Profiling and creating call graphs for Go programs with "go tool pprof"
- Python-like generator functions in Go